Chart builder
Last updated: June 12, 2026
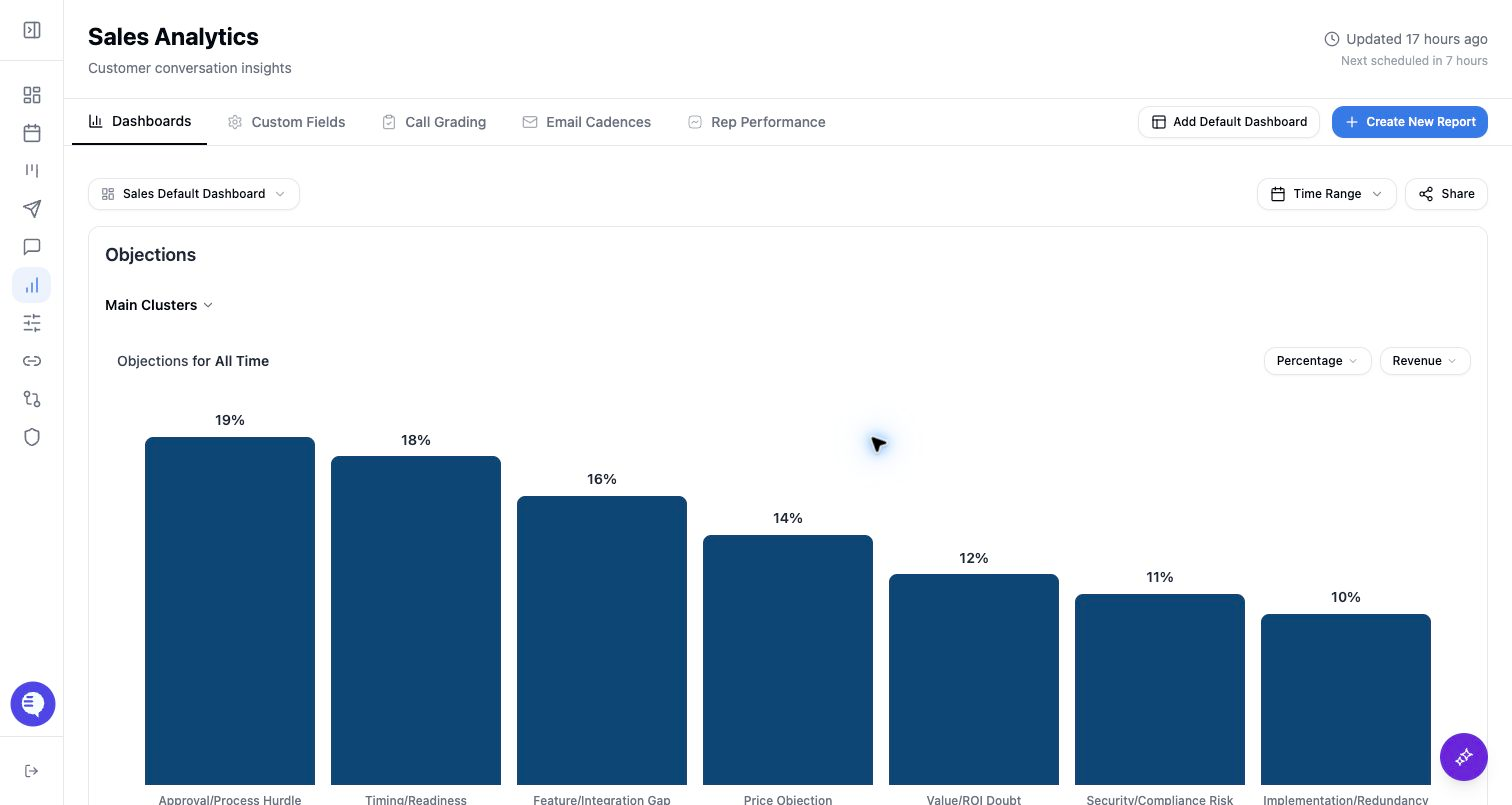
Chart Builder is where you design a single report before saving it to a dashboard.
Choose the main category
The main category controls what the chart counts or groups.
- Sentence fields group customer-conversation text into clusters.
- Picklist fields group by configured values.
- Numerical fields group by configured ranges.
- Rubric fields show call grading results.
- Correspondence count, revenue, and rubric-specific controls may appear only when enabled for your workspace.
Add a breakdown or filter
- Use a breakdown category to split the main category by another field.
- Use filters to limit the chart to selected field values.
- Numerical filters use configured ranges.
- Picklist and sentence filters use selected values.
- Correspondence type filters separate meetings and emails when the correspondence chart is enabled.
Rubric fields and deal/company-level fields have stricter compatibility rules. If a breakdown or filter is unavailable, choose a supported correspondence-level field instead.
Set time range and chart type
Available time range choices are:
- No filter
- Last 7 days
- Last 30 days
- Last 90 days
- Custom range
Saved chart types are bar and pie. The preview updates as you adjust the chart configuration.
Save the report
- Confirm the preview shows the expected field and filters.
- Select Save Report.
- Choose an existing dashboard.
- Decide whether to create another report or return to Reporting.